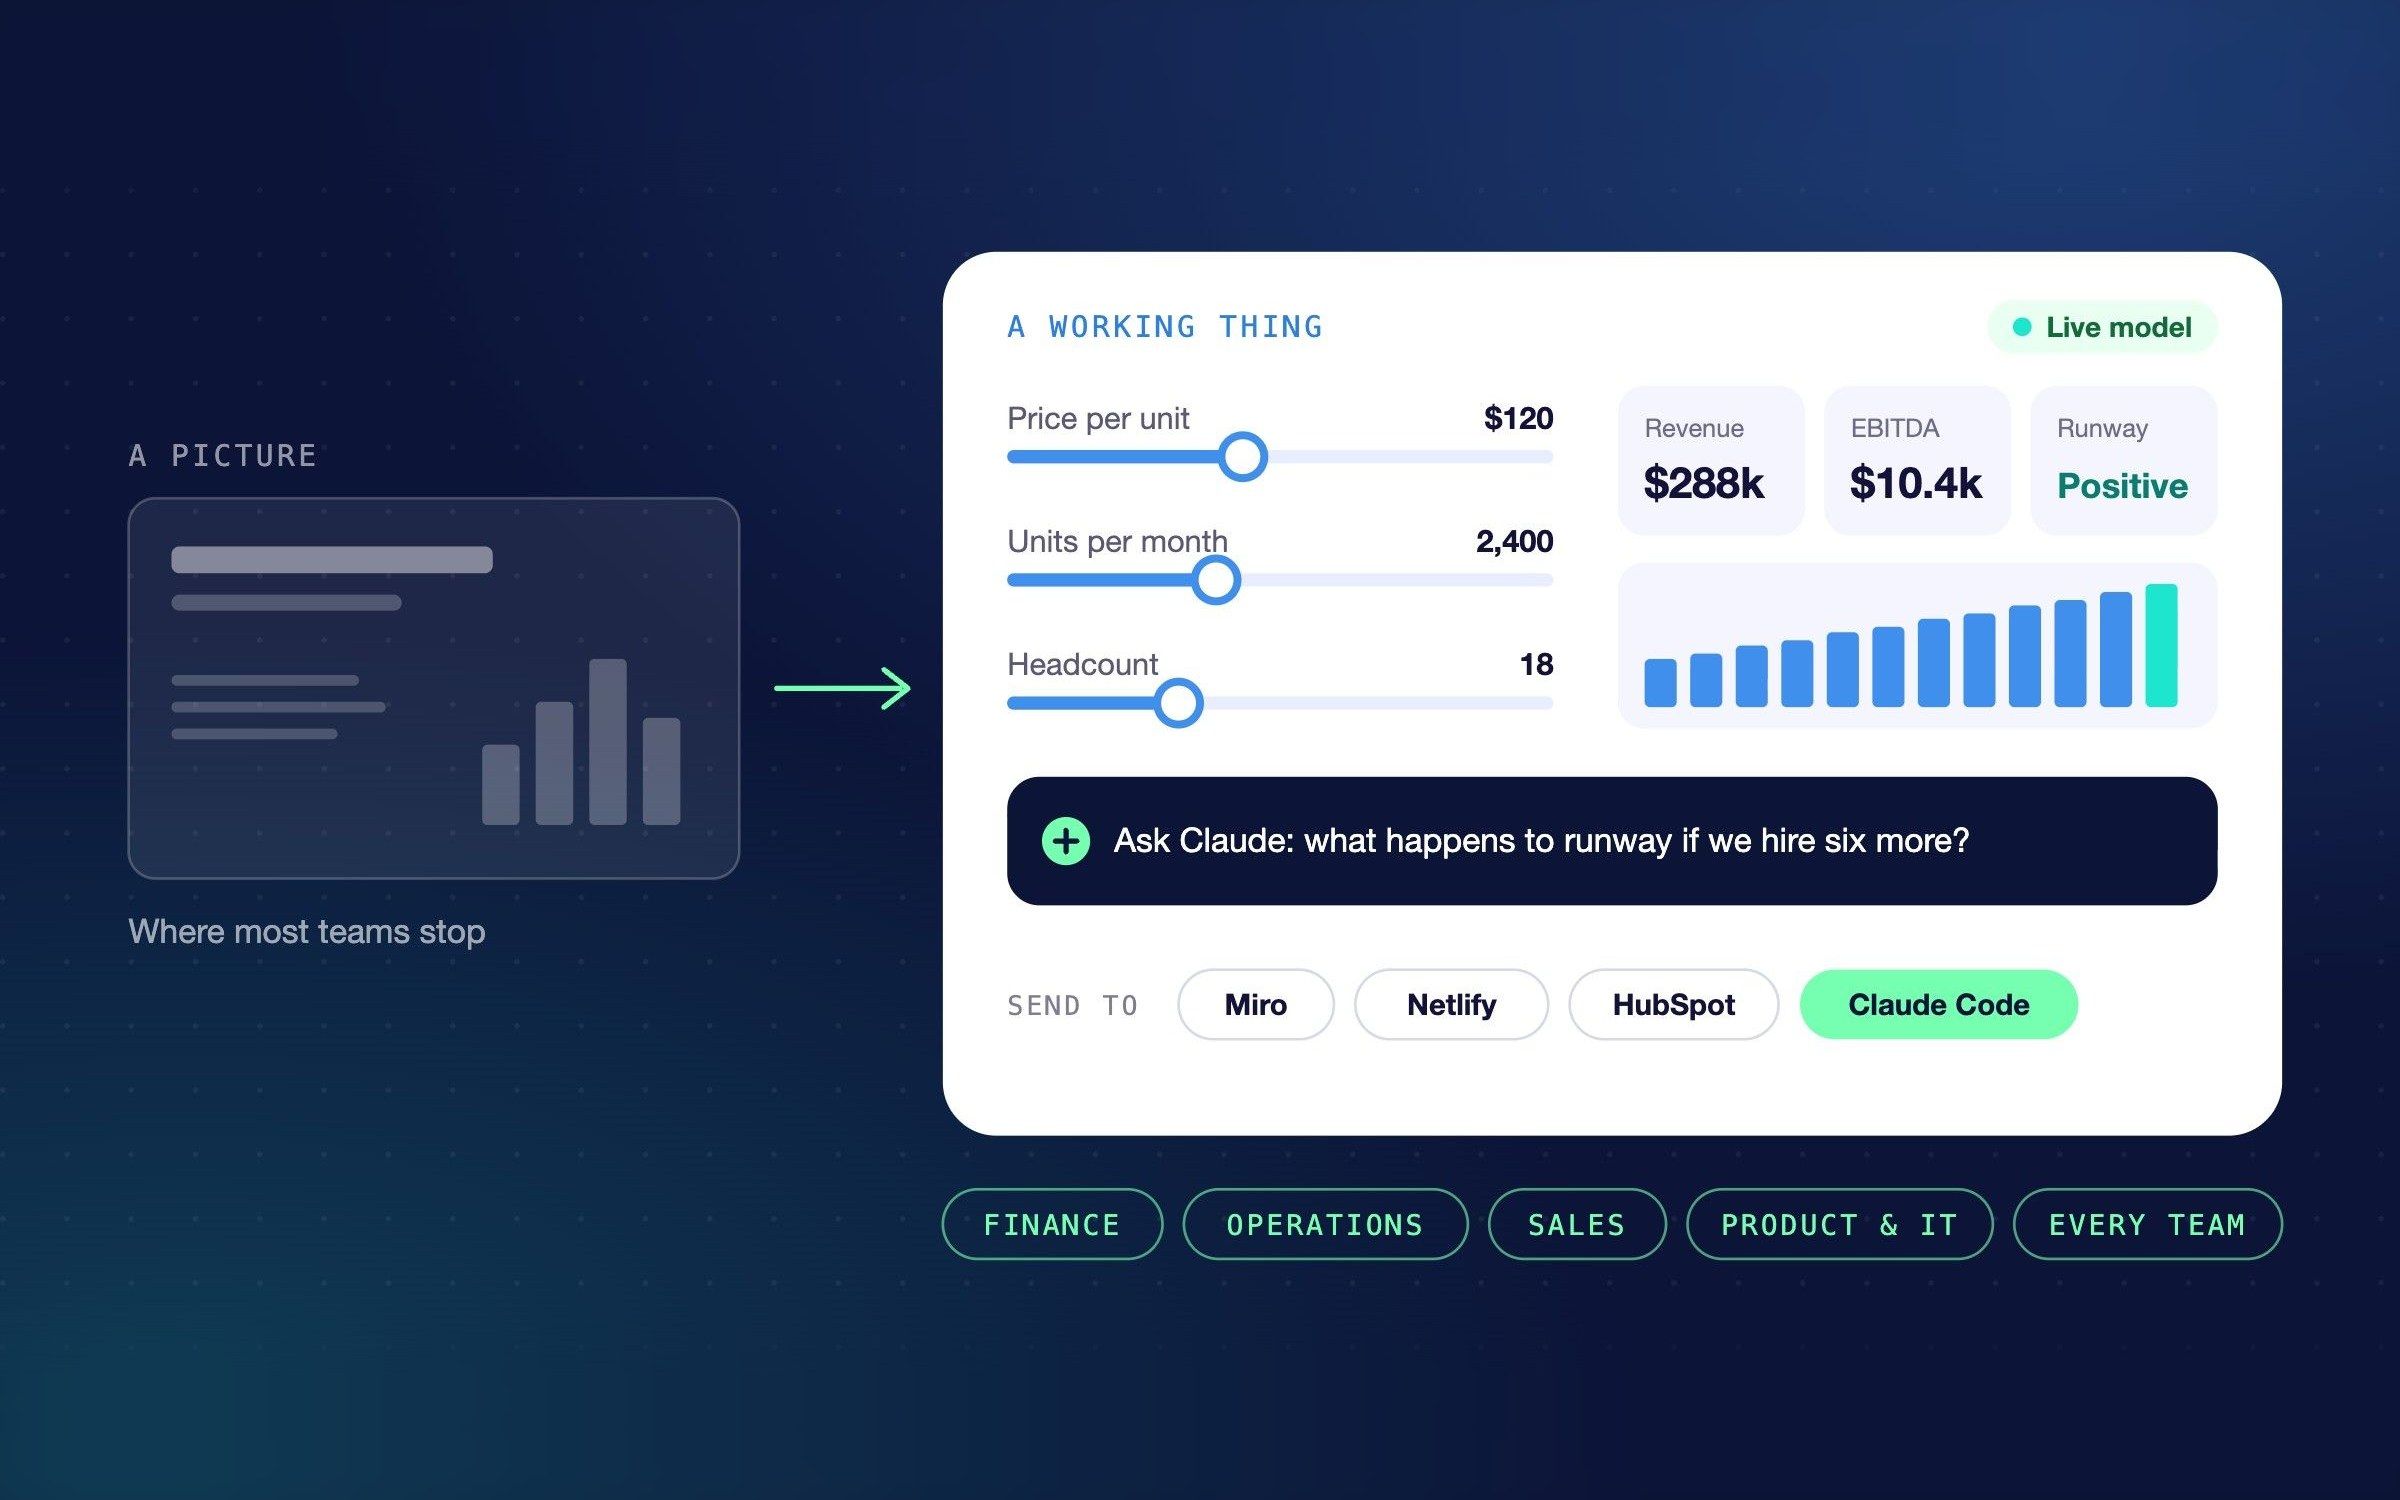

Claude Design is no longer just a way to make slides and landing pages. A design made in Claude can calculate, work with your company's data, run as a small tool with Claude working inside it, and hand itself to Claude Code to become working software. That makes it useful to finance, operations, sales and product teams, and most of them haven't noticed yet.
Why does everyone use it for slides?
Claude Design launched in April 2026 as a design tool, and it got written about as one. The first reviews compared it with Canva and Figma, and the first users made pitch decks, social posts and landing pages. Those are fine. They're also the least interesting thing it does.
The shift happened quietly. Since September, Design has worked inside every Claude conversation, with your files and connected apps (Anthropic). And what it makes isn't really a picture. It's a small piece of software that can hold numbers that recalculate, save data, read and write to your apps, and have Claude itself working inside it.
Once you see it that way, the useful questions move out of the marketing team.
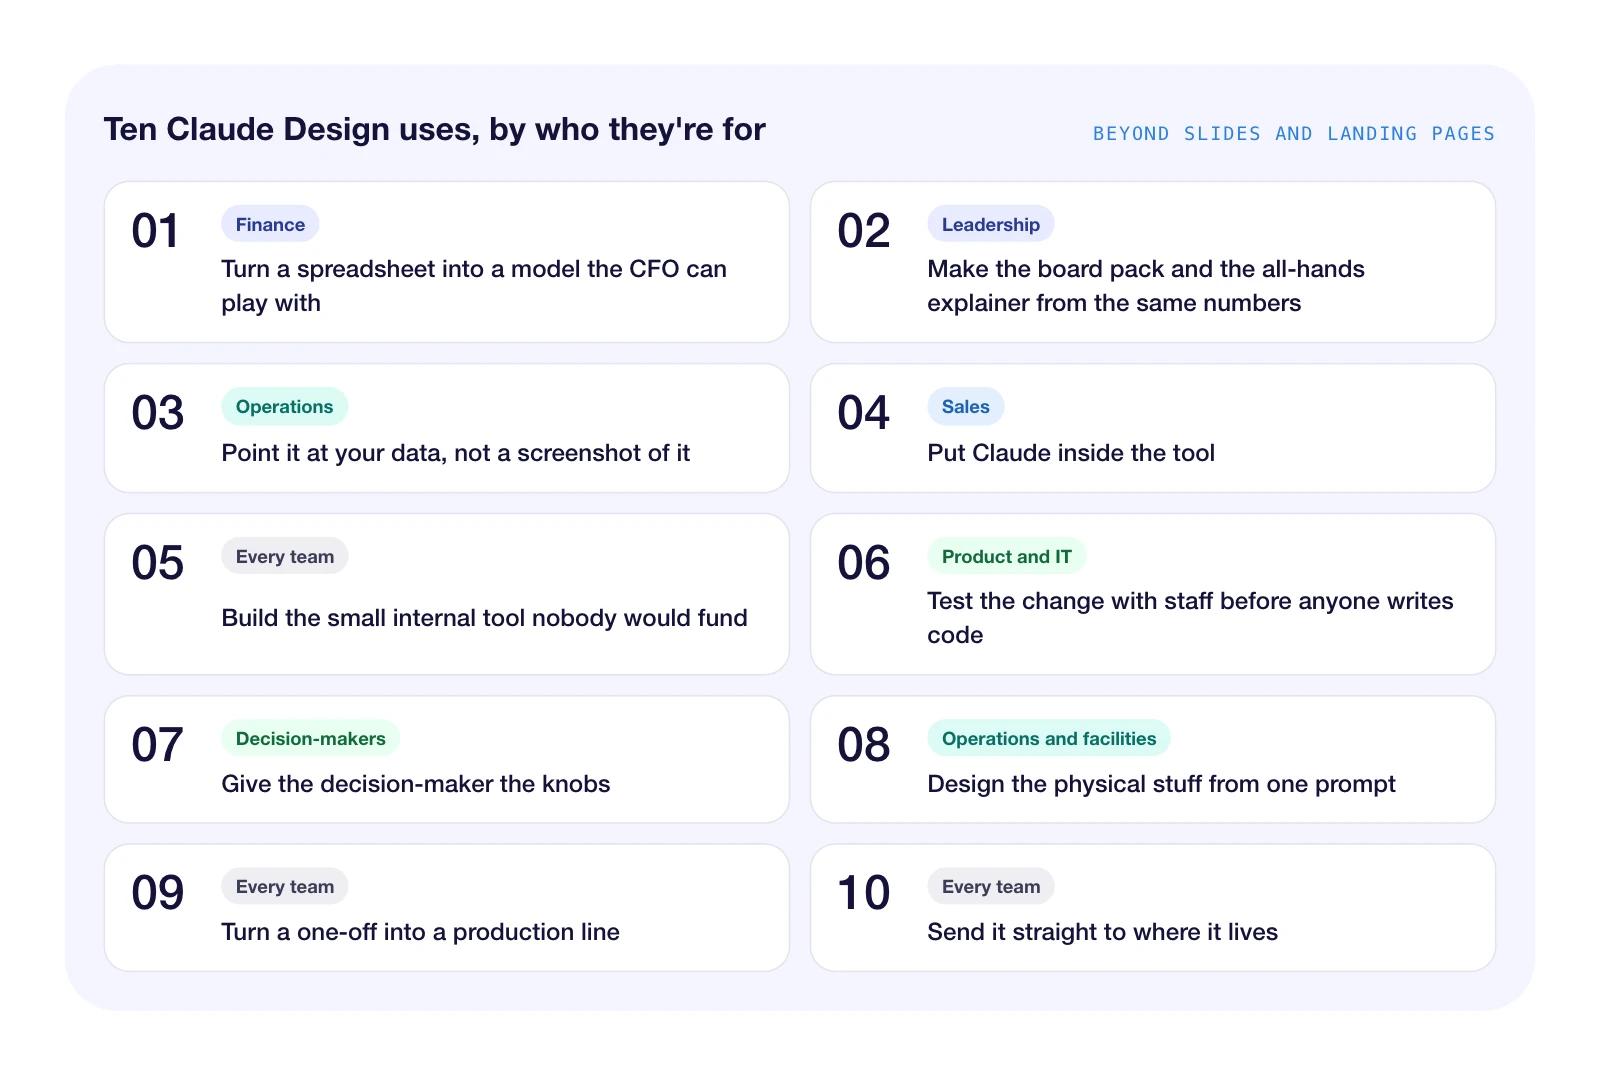
Ten Claude Design use cases at a glance
Here are the ten, grouped by who they're for. Each one below comes with a prompt you can paste in to try it.
1. Turn a spreadsheet into a model the CFO can play with
For: Finance
Give Claude Design a forecast spreadsheet and ask for a scenario model, not a chart. You get a screen with sliders for the assumptions, and the numbers move as you drag them.
Luke Finance built a scenario planning studio this way, where changing the business assumptions updates revenue, EBITDA, cash flow, debt and runway (YouTube, July 2026). It's the kind of thing a finance team used to brief out to a developer, or build in a fragile workbook with forty tabs.
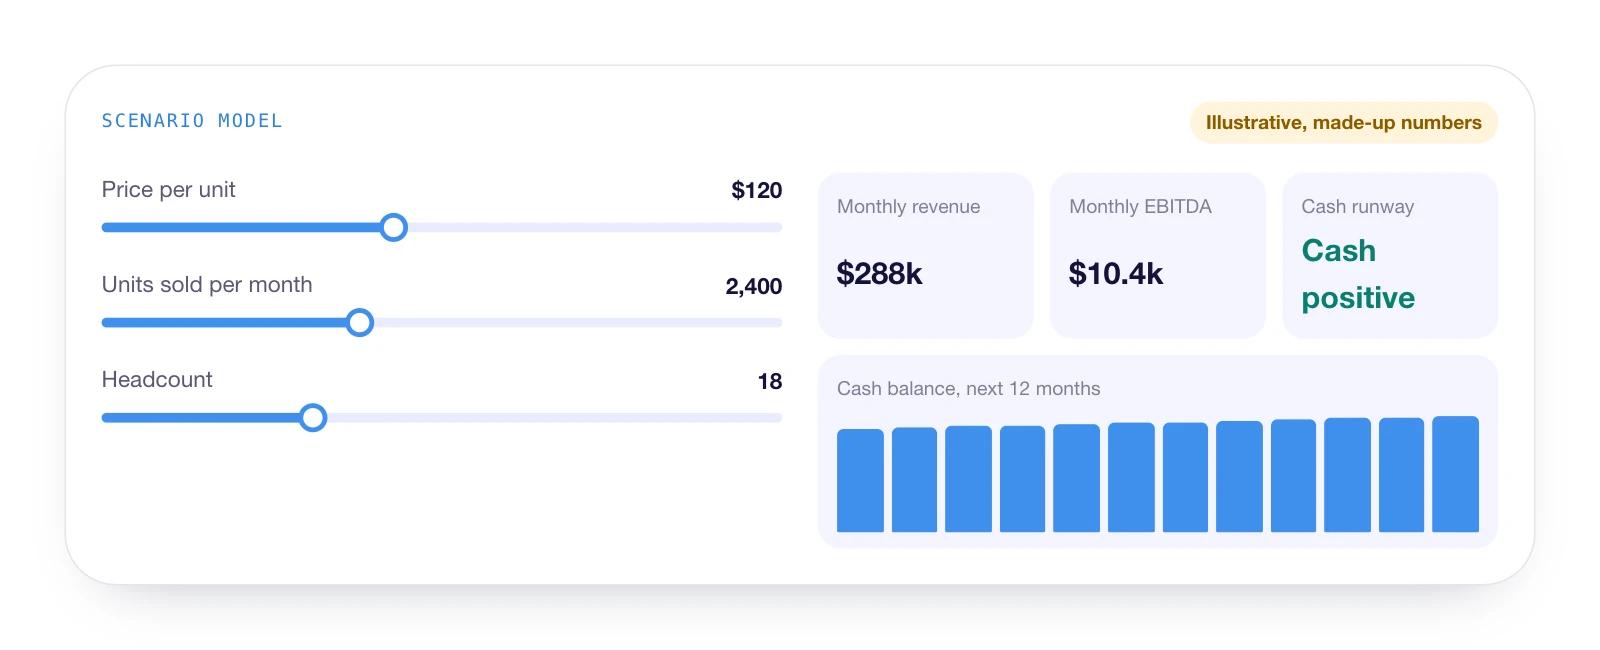
Try this prompt: Turn this forecast into a scenario model. Give me sliders for price, volume and headcount, and show revenue, EBITDA, cash and runway updating as I move them.
Watch out for: the model is only as right as its formulas. Check the logic against your own spreadsheet before anyone makes a decision with it.
2. Make the board pack and the all-hands explainer from the same numbers
For: Leadership
Quarterly numbers usually get made three times: once for the dashboard, once for the board and once for the all-hands. Claude Design can make all three from one sheet, so they don't drift apart. Christian Martinez went from a messy FP&A spreadsheet to a CFO dashboard, a board presentation and a short video briefing in about 30 minutes (YouTube, April 2026).
For the version that moves, Claude Motion makes short animated explainers. Anthropic's own example is a 30-second quarterly results explainer for an all-hands. It's built as code rather than generated footage, so changing a number means editing it, not re-rendering a video (Anthropic, October 2026).
Try this prompt: Using these quarterly numbers, make a one-page dashboard, a six-slide board summary and a 30-second explainer for the all-hands. All three must use exactly the same figures.
Watch out for: Motion is in beta, on Team and Enterprise plans only. And read every figure in all three versions. One wrong number in front of a board costs more than the whole exercise saves.
3. Point it at your data, not a screenshot of it
For: Operations
Most operations dashboards are a screenshot of last week. A design in Claude can read from and write to your connected apps, such as Asana, Slack or Google Calendar, with each person using their own login (Anthropic). That makes it a working screen rather than a report about one.
Darragh Murray showed how far the design side goes. He redesigned the Australian Energy Market Operator's electricity market dashboard in Claude Design, then sent it to Claude Code to build a working app, in under two hours (The Datavist, April 2026).
Try this prompt: Rebuild this screenshot of our weekly operations dashboard. Keep every metric, fix the layout and pull the figures from our connected tools.
Watch out for: maps and spatial layouts are a weak spot. Murray's state map came out as overlapping shapes he called a "pink blob". Check which apps your company has connected before you promise anyone a working screen.
4. Put Claude inside the tool
For: Sales
A design in Claude can have Claude working inside it. That turns a page into a small app: it asks questions, reads the answers and writes something back. There's no API key to set up, and on Team and Enterprise plans, colleagues can use what you share without adding to your costs (Anthropic).
For a sales team, that's an account research tool, a discovery question generator or a first draft of a proposal, built in an afternoon by the person who'll use it.
Try this prompt: Build a tool for our sales team. They paste in a prospect's website and their call notes, and Claude writes an account summary and three discovery questions.
Watch out for: everyone who uses it signs in with their own Claude account. That's fine for your own team. For a tool you want prospects to use on your website, design it here, then hand it to Claude Code to build as a proper web app.
5. Build the small internal tool nobody would fund
For: Every team
Every company has a list of small tools nobody will pay for: an approvals tracker, an intake form, a shared checklist. Claude Design can build them, and they can keep data, either private to each person or shared by everyone using the tool (Anthropic). The person who needs the tool can build it, which is usually the hard part.
Nate Parrott, the product designer who built Claude Design, takes this further. He isn't an animator, so when he needed an animation, he had Claude build him a bespoke video editor first, then made the animation in it (Anthropic, July 2026).
Try this prompt: Build an approvals tracker for our team. Anyone can add a request, the approver ticks it off, and everyone sees the same list.
Watch out for: stored data is text only and capped at 20 MB per tool, and whoever builds it decides what's shared. Check that before anyone types in something sensitive.
6. Test the change with staff before anyone writes code
For: Product and IT
Changes to internal systems usually get argued about, built, and then found to be wrong. Claude Design lets you test the change first. Start from a screenshot of the current screen or a photo of a whiteboard sketch, and get a clickable version staff can try (Anthropic).
Paweł Huryn pointed it at his product's code and had a clickable admin onboarding flow, on his real design system, in about 10 minutes (Product Compass, May 2026). When it's right, send it to Claude Code. Victor Dibia took that route to turn Google Analytics and Stripe exports into a live feature on his site, in about 45 minutes of his own attention against an estimated week of engineering (April 2026).
Try this prompt: Here's a screenshot of our expense claim form and a photo of the whiteboard redesign. Make a clickable version our staff can try on their phones.
Watch out for: it makes choices you didn't ask for. Dibia had to steer it back to country-level figures so customer data stayed private.
7. Give the decision-maker the knobs
For: Decision-makers
The slowest part of most design work is the feedback loop: send a version, wait for comments, change it, send it again. Claude Design can cut that out by building controls into the design itself. Sid Saladi's example has a panel where you toggle dark mode and switch row density live (April 2026), and Claude will build custom sliders for whatever you need to compare.
So give the sliders to the person deciding and let them settle it. Parrott's advice from inside Anthropic is to ask for ten options, then remix the best, and he notes that direct edits use no tokens (Anthropic, July 2026).
Try this prompt: Give me ten layouts for our customer portal home screen, then add sliders for density and colour so the operations director can compare them herself.
Watch out for: someone still has to own the final call. Ten options and a set of sliders can turn a decision into a hobby.
8. Design the physical stuff from one prompt
For: Operations and facilities
Nobody thinks of an AI design tool for lanyards. Event Tech Live does. From one foundation prompt, the team makes A1 registration signs, A2 room signs, 90 × 120mm badges for five roles, an A0 "you are here" board and "session has moved" holding slides. "We use this every show" (Event Tech Live, June 2026).
The same approach works for anywhere with printed things on the walls: offices, warehouses, clinics and venues.
Try this prompt: Create our signage kit: A1 directional signs, A2 room signs, 90 × 120mm name badges for five roles and an A0 "you are here" board, all on brand.
Watch out for: treat large-format print as a strong first draft. Event Tech Live still puts big signage through a print workflow for resolution, bleed and CMYK, and says stage graphics still deserve a designer.
9. Turn a one-off into a production line
For: Every team
Most reports are the same document with new numbers. Lock the format once, save it as a skill and rerun it. Annika Helendi does this for a month of LinkedIn content: about an hour to set up, then under ten minutes of work for 30 branded posts, saved with one instruction, "save this as a Skill" (August 2026).
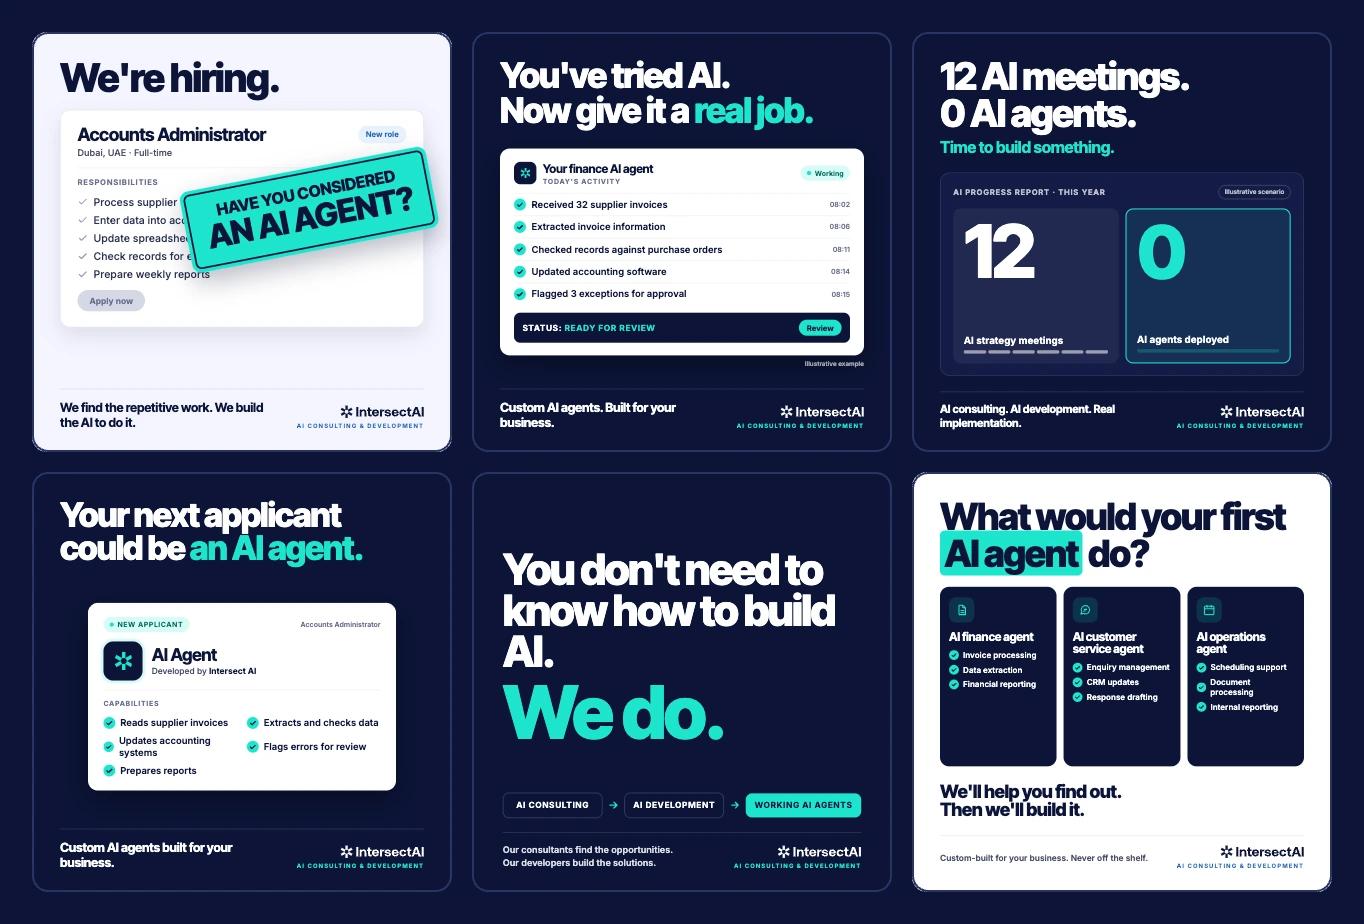
The same move works for a monthly operations report, a weekly sales update or a client status pack. We used the same principle on our own campaign targeting the UAE: every ad concept came in five versions from the start, so the test plan was built into the work rather than added later.
Try this prompt: Make this month's operations report from the attached data, then save the format as a skill so we can rerun it next month.
Watch out for: a production line repeats its mistakes too. Check the first few outputs closely before you trust the batch.
10. Send it straight to where it lives
For: Every team
A design shouldn't end as a file someone downloads and re-keys. From Claude Design you can export to PDF, PowerPoint, Google Slides or HTML, send it to Miro, Canva, HubSpot, Netlify, Vercel, Replit, Lovable and others, or hand it to Claude Code (Anthropic).
So a workshop board lands in Miro, a prototype becomes a live site on Netlify, and a page goes into HubSpot as a draft. Our own recent blog posts went into our content management system as drafts, images and all.
Try this prompt: Send this to Miro for Thursday's workshop, and send the prototype to Netlify so the team can open it as a live site.
Watch out for: exports aren't perfect. Testers have found PowerPoint exports dropping colours, backgrounds and charts (DesignX, May 2026), so check anything that leaves Claude.
Where does Claude Design still fall short?
It's good, and it isn't finished. Five things to know before you build a process on it:
- It can change things without telling you. In one test session, Claude quietly rewrote a headline between versions (DesignX, May 2026). Check every number before it reaches a board.
- Default output looks generic until your brand is loaded. Our guide to getting your brand into Claude covers that.
- It doesn't generate images. It lays out and draws with code, so photos and logos come from elsewhere (Anthropic).
- There's no version history. Ask Claude to save a state before a big change.
- Heavy sessions add up. Early testers ran through a week's allowance in about half an hour (PCWorld, April 2026). Plan the session before you start.
What to do this week
Pick the one item closest to work you already pay for, and try it on real data. For most finance teams that's the scenario model. For operations, it's the dashboard someone screenshots every Monday. Give it an afternoon, then decide.
If you'd like help turning one of these into something your team uses every week, book a call with us.
FAQ
Is Claude Design a separate product?
Not any more. Since September 2026 it works inside any Claude conversation, and the standalone site at claude.ai/design closes on 14 December 2026 (Anthropic).
Which plans include it?
Design, Slides and Docs are on every plan, including Free. Claude Motion is in beta on Team and Enterprise plans only (Anthropic).
Do people need a Claude account to use what I build?
For anything with Claude working inside it, yes: each person signs in with their own Claude account (Anthropic). Exports such as PDF, PowerPoint and HTML work for anyone.
Related reading
- How to get your brand into Claude so it designs on-brand
- What is an AI agent? What business leaders need to know
- 10 time-consuming business tasks that AI can automate today
Sources
- Anthropic: Build live dashboards and animate explainers, 8 October 2026
- Anthropic: How the product designer who built Claude Design uses it, 24 July 2026
- Claude Help Center: What are artifacts, checked 28 October 2026
- Claude Help Center: Get started with Claude Design, checked 28 October 2026
- Luke Finance: Claude Design for finance, 21 July 2026
- Christian Martinez: FP&A spreadsheet to CFO dashboard, 26 April 2026
- The Datavist: Are my dashboarding days numbered?, 18 April 2026
- Product Compass: Claude Design for product discovery, 4 May 2026
- Victor Dibia: How good is Claude Design?, 21 April 2026
- Sid Saladi: Claude Design 101, 28 April 2026
- Event Tech Live: one-prompt design system for event teams, 18 June 2026
- Annika Helendi: How I make a month of LinkedIn posts, 1 August 2026
- DesignX: Testing Claude Design, 1 May 2026
- PCWorld: I tried Claude Design for half an hour, 17 April 2026